

Today’s cities are making us fat – they’re Obesogenic. A recent study out of Toronto finds that the characteristic of the built environment can have damaging effects on people’s health by causing obesity and, in turn, diabetes. The Globe and Mail reports on the study:
A poor diet, high in saturated fat and low on fruits and vegetables, causes excess weight. […] A sedentary lifestyle fuels the problem. That’s why some medical researchers and health offices are joining forces with urban planners to design neighbourhoods that are more conducive to activity.
Healthy eating combined with increases in physical exercise – walking with the kids to school or biking to the cinema – would help to mitigate the rise in the prevalence of obesity over the last two decades.
Further exacerbating the problem is bad access to healthy foods in cities – food deserts.
But there’s hope. The Times Online reports that
Oslo in Norway is an example of a “slim city”, where the built environment is structured to discourage car use and encourage walking and cycling. Urban planning in the Netherlands and Denmark has also incorporated more physical activity in daily lives, lowering obesity rates.
— 60 per cent of all journeys made by Dutch people aged over 60 are by bike.
— 10.4 per cent of Dutch men and 10.1 per cent of women aged 20-60 are obese. In England, 24.9 per cent of males and 25.2 per cent of women over 16 are obese [in US: About one-third of adults (33.8%) are obese]
The website, the color of is an attempt to find the color of anything by aggregating tagged Flickr pictures. Here is the color of Dayton, OH.


Using its data of real estate searches by location, Trulia has put together an interactive map of top real estate searches in US cities searched by internationals. The idea is that these cities are the top cities for people looking to immigrate to the US, and it differs based on the immigrant’s native country.
For example, Mexicans search for property listings mostly in El Paso TX and San Diego, CA, while Japanese search for LA and Honolulu.
Shortumentary on what is, by far, the best (and cheapest) way to see Manhattan, the High Line.

Phase 2 High Line at Night
Shortumentary video on Detroit’s burgeoning bike culture, putting the city’s many unused car lanes to better use.

Meet CityCar, a prototype car designed to meet the demand for enclosed personal mobility – with weather protection, climate control and comfort, secure storage, and crash protection – in the cleanest and most economical way possible. It weighs less than a thousand pounds, parks in much less space than a Smart Car, and is expected to get the equivalent of 150 to 200 miles per gallon of gasoline. Since it is battery-electric, it produces no tailpipe emissions.
The architecture of the CityCar is radical. It does not have a central engine and traditional power train, but is powered by four in-wheel electric motors.
Video on the Greater Downtown Dayton Plan. It has plenty of tilt-shifted aerial shots to make me happy.
Great shortumentary on Beaverton, Oregon looking to find its downtown. Like too many cities, Beaverton developed in sprawl and is auto-oriented without an identifiable center place that is built towards people, but they’re trying to change that.
Well here is one concept on how to have better transportation within our cities: put it on a turntable!
“Clockwork City” is the fantastical vision of animator Roy Prol calling for a city of rotating rings that change the notion of getting around in large city. As the video notes, the 3,000 meter diameter “Clockwork City” won’t need cars or even transit since work and home are a mere minutes away, anywhere in the city. The city itself is in effect one large form of public transportation. To get to work, the video notes, “Just wait at home until you see your workplace closer.”
(via A|N Blog)
There are several great online sites/mobile apps that are priceless when looking to a relocate to a new city, or a new part of a city that go beyond the obligatory Google search, Wikipedia, and craigslist.
Want to see the new city closer? Try Google Maps Street View, Bing Maps Streetside, and Bing Maps Birds Eye View. Street View is priceless when it comes to walking around a city’s streets virtually. Google Street View has extensive coverage in cities across the U.S. and globally giving a great sense of what the city is like. Similarly, Microsoft Bing’s Streetside (as posted on here) gives a clearly and more vibrant view of buildings along the street, but has poorer coverage. Where Bing Maps shine is in the Bird’s Eye View, giving a better and closer aerial view of the city, which can be rotated to see from different angles.

Downtown Dayton Birds Eye
There are several great online sites/mobile apps that are priceless when looking to a relocate to a new city, or a new part of a city that go beyond the obligatory Google search, Wikipedia, and craigslist.

Looking for housing in a new city? Try Padmapper. The website (and lesser featured mobile app) is a true map mashup. It takes apartment listings on craigslist, rent.com, apartments.com and more and places it on a Google Map. Information about the apartment’s Walkscore and Street View are included. Additionally, some area have added features to see crime statistics, neighborhood names/boundaries, and a Commute Overlay, a distance-to-location calculator (input an address, say workplace, and a distance buffer is added to the map showing what listings are within proximity).
Want to know what your neighbors would be like? Try Esri’s Tapestry Segmentation map (as earlier post here) to find out what TV shows your neighbors are prone to watch, and what stores they shop in.
There are several great online sites/mobile apps that are priceless when looking to a relocate to a new city, or a new part of a city that go beyond the obligatory Google search, Wikipedia, and craigslist.

Want to quickly learn about the new city? Try Qwiki. The video Wikipedia. Search for a city on Qwiki and it combs the interwebs for information, maps and pictures of that city and strings them together to create a quick 2-3 minute video that introduces basics about the city. For example, here’s Dayton, OH’s Qwiki.

Here is a map of the top 10 dangerous cities for pedestrians using data from the Transportation for America’s Dangerous by Design 2011 report.
The top 4 metro areas are in Florida! And all top 10 11 metros are in the South and South West.
GQ Magazine has compiled a list of the 40 worst dressed cities in the U.S.A, and they didn’t go easy. Here are the top 5.
- Boston
It’s hard to be a fashion capital when half of your population is made up of undergraduate hoodie monsters, including those unfortunate coeds who don’t realize that leggings-as-pants were supposed to be paired with tops large enough to conceal their cameltoes.
- Los Angeles
Why should we expect Angelenos to ever recover from the aesthetic thrill of Ed Hardy? It’s smart if you think about it, why actually get a full body tattoo when you can buy the sartorial equivalent of one. - Pittsburgh
There is no city on Earth that can equal the utter sloppiness of Pittsburgh. - Chicago
The Parka Pierogi. Ingredients: Blown-out Nikes; torn cargoes; favorite novelty T-shirt; Bears/Bulls/Blackhawks hoodie—all wrapped up in a totally nondescript parka. - Manhattan
For every strike of greatness, there is an equal force of evil at work. Consider the Nine-Bro. You know, the pack of nine guys who walk down the street in unison, should-to-shoulder, outfitted in tacky black “Go Out” button-downs, embroidered denim, and product-inspired conflagrations on their head.

Other New York cities that made the list: Buffalo at #25 and Brooklyn at #11 .
Using geotaged data from Twitter and Flickr, the maker of these series of maps, was able to create stunning illustrations of cities. The data from Twitter is shown in blue, and Flickr in yellow. Co. Design’s Cliff Kuang comments on the visualization stating that the vast disparity between a city seen by a tourist vs. a native is captured in the city maps:
It’s no less than a visual map of how differently cities look when you view them through the eyes of a tourist or a native. Sometimes, those visions line up. But having been a New Yorker for 10 years, I can vouch for the fact that the city I love isn’t the one that tourists ever get to see. So much of what I experience remains invisible unless you’ve been here for a while — and that, I’d argue, is the greatest mystery of city life.
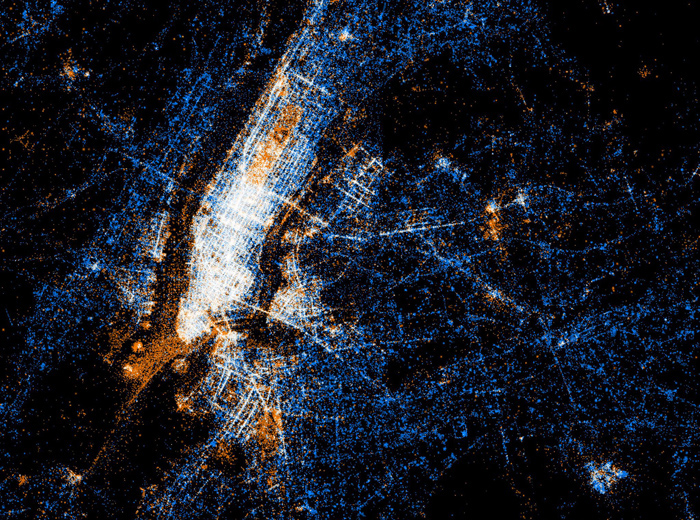
Eric Fischer's Twitter/Flickr Map of New York City
Recently, a couple of articles have been released on studies looking at the effects of the built environment on health. And interestingly they are in conflict (at least on the surface).
The first is on mental health and explains that urbanites are more prone to stress:
“Imaging scans show that in city dwellers or people who grew up in urban areas, certain areas of the brain react more vigorously to stress. That may help explain how city life can boost the risks of schizophrenia and other mental disorders, researchers said.”
Another says when looking at rural, urban and suburban areas, urbanites come in second after suburbanites on the race to health:
“To be sure, city dwellers live with more air pollution and violent crime. They also have higher rates of sexually transmitted diseases and low-birth-weight babies and are more likely to drink excessively.”
“In many measures, residents of suburban areas are the best off. They generally rate their own health the highest and have the fewest premature deaths than either their urban or rural counterparts. Suburbanites also have the fewest low-birth-weight babies, homicides and sexually transmitted diseases.”
And according to this article, a third study reverses this and says that city dwellers are healthier because:
“No matter which country you are in, new research finds those who live in an urban neighborhood are twice as likely to be physically active the those in the suburbs.”
So which is it?
These maps of race and ethnicity in 40 U.S. are simply stunning. Instead of the usual homogenous swatches of polygons used to represent the racial make-up of a city’s neighborhoods, these maps give a more tangible representation of what the neighborhoods are like by using dots to indicate population groups.
The maps use U.S. Census 2010 data (there is also a 2000 series) and each dot represents 25 people.
- red is White,
- blue is Black,
- green is Asian,
- orange is Hispanic, and
- yellow is Other.
Here is the map for New York:

![]()
The City of Boston has a new app for its residents that allows them to use their smartphone’s accelerometer (the sensor that detects movements to know how the phone is being held) to locate and register potholes.
Street Bump will provide the City with a near-real time picture of Boston’s road conditions and the location of its potholes. Street Bump should give the City the information it needs to make your travels through our city even easier.
The app is currently in beta/prototype and available only for Android.
Tilt-shift gorgeousness in Berlin time lapse video.
While Google Maps Street View service that provides 360 photographs of streets across the globe is well know, Microsoft Bing Maps has a corresponding service, Streetside, which is equally as useful and fun.

Streetside doesn’t provide 360 views like Google’s service, instead, it gives a full wide photograph of each side of the street. Although the service currently has a coverage area smaller than Street View’s (Albany is not on Streetside), it is a great way to see the fronts and signage of stores and businesses for way-finding. By focusing on just the sides of streets and buildings, Streetview gives the user the unique opportunity to travel slide down a street looking at just facades in a way not really possible otherwise (in real life, or Street View).
Tapestry Segmentation gives insight into the lifestyles of residents in different parts of cities.
Using demographic and market analysis, Esri divides the U.S. population into 65 distinct segments to provide detailed descriptions of neighborhoods. The Tapestry defines consumer types and can be used as a marketing tool to tailor messages to specific audiences.
This interactive map takes the Tapestry data and shows the predominant profile for each zip code in the U.S.
Take, for example, the Albany, NY area.

Center Square is described as “Metro Renters” (#27). Its residents are young, educated singles just beginning their professional careers. They “will sometimes share housing with a roommate to help defray the cost of their high rent. Metro Renters residents work out regularly at clubs, play tennis and volleyball, practice yoga, ski, and jog.” They are also seldom TV watchers and vote liberal.
The Midtown area is suitably described as “College Town” (#55).
The Buckingham Lake Neighborhood is “Prosperous Empty Nesters” (14). They are mostly aged 55 and older, retired and have no children living at home. “They exercise regularly and take a multitude of vitamins. They refinish furniture and play golf.” They also read biographies, mysteries and history books, and watch golf, news and talk shows on TV.
Video on scenes of New York City, its people, trains, bustling streets and more, all remixed with a beat from a subway performer. What’s not to love.
Video explores the changes the Verrazano-Narrows bridge, which connects Brooklyn to Staten Island, brought (and still is bringing) to NYC when it was completed in the 1960s. It changed the face of development on both sides in Brooklyn and Staten Island – removing neighborhoods in Brooklyn, and spurning new ones in Staten Island. The video’s narrator comments that the Staten Island county – Richmond, is the fastest growing in New York State.
Vodpod videos no longer available.Using GDP and population projections the Business Insider has compiled a list of the 12 international cities most likely to see extreme growth in the next decade or two. Interestingly London is at the top of the list – the city expected to experience the most growth by 2025. No U.S. city made the cut, though New York (as well as Tokyo) will continue will being the big cities.
The list from #12 to #1:
- 12, Rio de Janeiro
- 11, Guangzhou
- 10, Delhi
- 9, Beijing
- 8, Hong Kong
- 7, Moscow
- 6, Mumbai
- 5, Buenos Aires
- 4, Shanghai
- 3, Mexico City
- 2, Sao Paulo
- 1, London

London: Global City See to Most Growth by 2025
What do a giant air-recycling wheel, a dome-like flat solar skyscraper, and a tower in the Hoover Dam have in common? They were all ideas conceived for an architecture design competition.
eVolo Magazine, an architecture and design journal, recently announced the winners of their annual Skyscraper Competition which recognizes outstanding ideas that redefine skyscraper design through the use of new technologies, materials, programs, and aesthetics.
The winners of the 2011 competition were the three ideas above:
The LO2P: Delhi Recycling Center

The Flat Tower

The Tower in the Dam

National Geographic Online has recently posted a gallery of photos of ancient Lost Cities. The list includes the famous Machu Picchu, Ancient Troy, and Stonehenge, England, and the lesser known Petra, Jordan; Persepolis, Iran; and Mohenjo Daro, Pakistan.

Stonehenge, England

Mohenjo Daro, Pakistan

Persepolis, Iran
The Capital Bikeshare program in Washington D.C. is proving to be an unprecedented success. Evidently, 114 kiosks that distribute some 1,100 bikes around Washington D.C. and Arlington, VA, are not enough to meet the high demand. And meanwhile cities like Denver, Minneapolis, and NYC are looking to start their own programs. Matt Friedman reports in the Associated Press video below.
(via Planetizen)
- Electric vehicles
- Smarter health systems
- Smart water/waste management
- Sentient buildings
- Predictive policing
“What if tomorrow everyone’s car disappeared?” That’s what inspired this filmmaker to create the time lapse video below. Using a bit of magic trickery (potion ingredients explained here) cars were removed from the landcape. The video is serene but with a post-apocalyptic sensation.
Amsterdam Smart City is a collaborative project between Amsterdam residents, businesses and governments working to illustrate how energy can be used more sustainably. They are developing new smart projects that may someday be a part of cities worldwide, and are testing them in Amsterdam.
Amsterdam Smart City interactive website showcases some of these project ideas:
- measuring buildings energy usage online in realtime
- outdoor solar-powered internet hotspots
- smart battery charging systems for cars
- food grown in abandoned buildings under LED lights

Web app Robot Flâneur allows you to vist and explore a city right from your desktop by using the Google’s Street View of major cities. When launched, views from a selected city fills up the screen and refreshes randomly every 30 seconds. The site currently has feeds from 9 international cities. Set it in fullscreen as a screensaver and be taken on a serendipitous trip.
